Deploying Prometheus with One-Click Apps
Updated by Linode Contributed by Linode
Use Prometheus to collect metrics and receive alerts with this open-source monitoring tool. Prometheus monitors targets that you define at given intervals by scraping their metrics HTTP endpoints. This tool is particularly well-suited for numeric time series data, which makes it ideal for machine-centric monitoring as well as monitoring of highly dynamic service-oriented architectures.
Deploy Prometheus with One-Click Apps
Linode’s One-Click App Marketplace allow you to easily deploy software on a Linode using the Linode Cloud Manager. To access Linode’s One-Click App Marketplace:
Log in to your Linode Cloud Manager account.
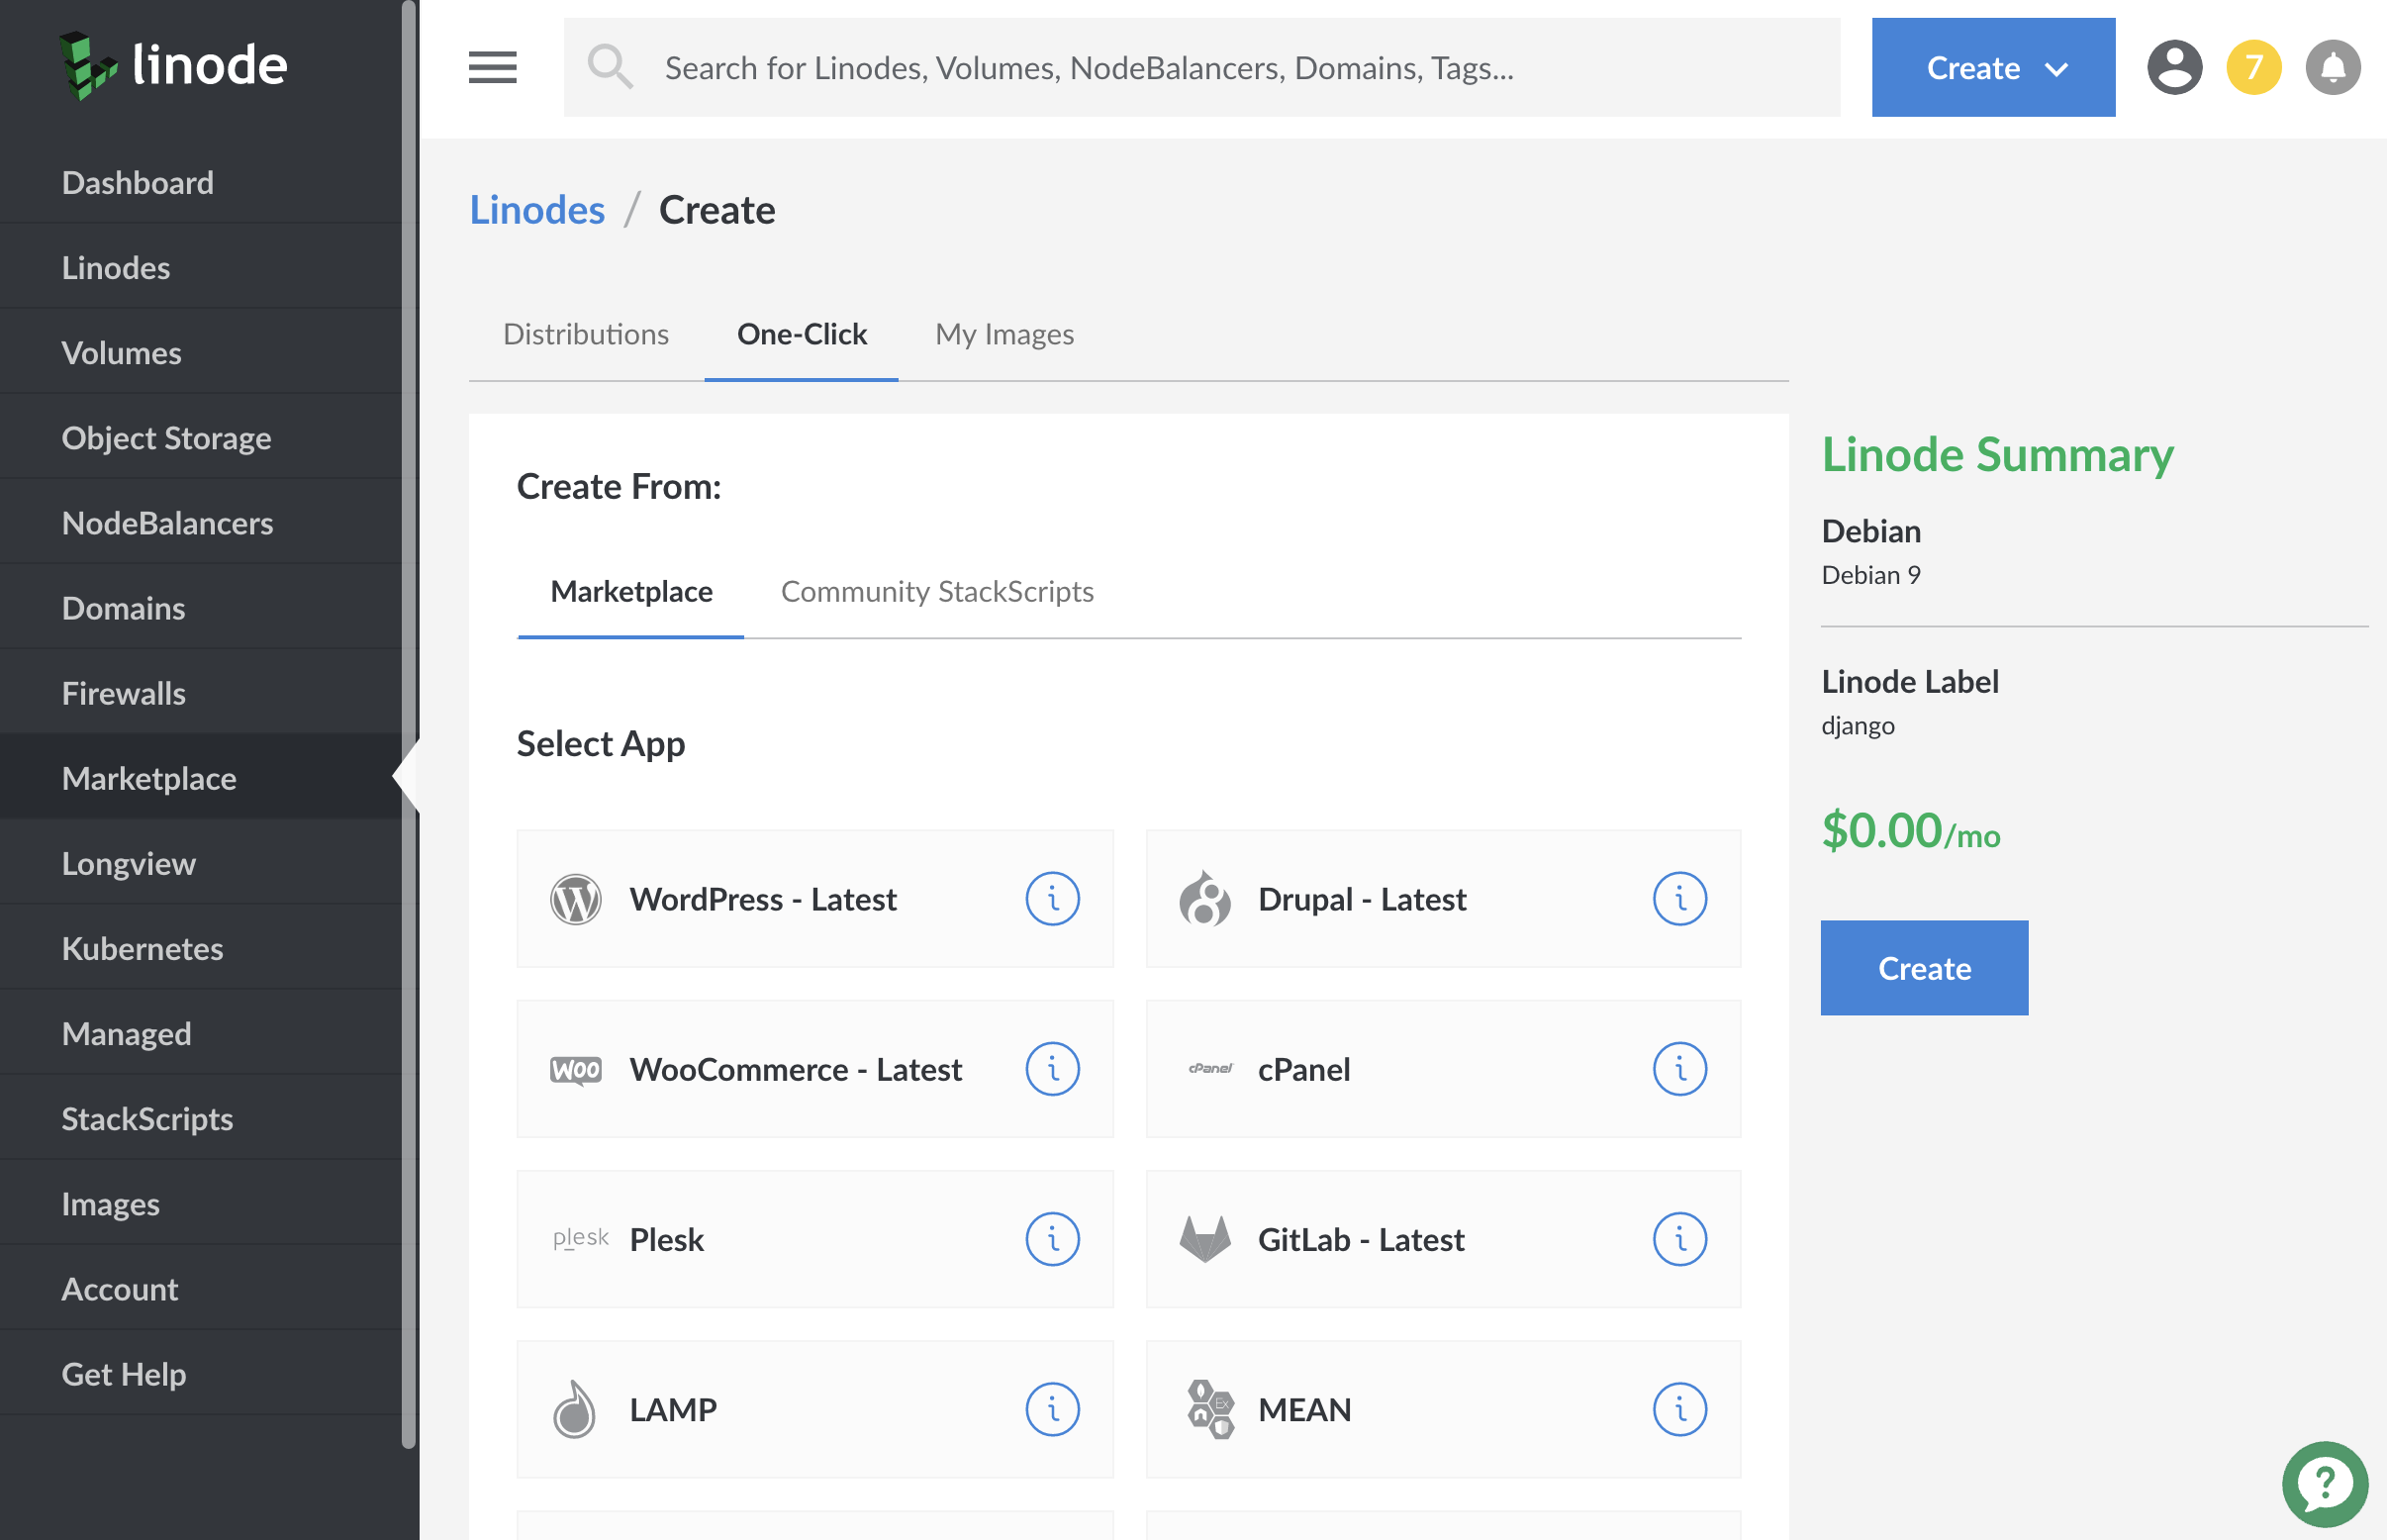
From the Linode dashboard, click on the Marketplace button in the left-hand navigation menu.
The Linode creation page will appear, with the One-Click and Marketplace tabs pre-selected.
Under the Select App section, select the app you would like to deploy:

Once you have selected the app, proceed to the app’s Options section and provide values for the required fields.
Linode Options
Provide configurations for your Linode server. The table below includes details about each configuration option.
| Configuration | Description |
|---|---|
| Select an Image | Debian 9 is currently the only image supported by the Prometheus One-Click App, and it is pre-selected on the Linode creation page. Required |
| Region | The region where you would like your Linode to reside. In general, it’s best to choose a location that’s closest to you. For more information on choosing a DC, review the How to Choose a Data Center guide. You can also generate MTR reports for a deeper look at the network routes between you and each of our data centers. Required. |
| Linode Plan | Your Linode’s hardware resources. Prometheus’ default settings require 3 GBs of memory. We recommend, at minimum, that you start with a 4 GB Linode plan. You can always resize your Linode to a different plan later if you feel you need to increase or decrease your system resources. Required |
| Linode Label | The name for your Linode, which must be unique between all of the Linodes on your account. This name will be how you identify your server in the Cloud Manager’s Dashboard. Required. |
| Add Tags | A tag to help organize and group your Linode resources. Tags can be applied to Linodes, Block Storage Volumes, NodeBalancers, and Domains. |
| Root Password | The primary administrative password for your Linode instance. This password must be provided when you log in to your Linode via SSH. It must be at least 6 characters long and contain characters from two of the following categories: lowercase and uppercase case letters, numbers, and punctuation characters. Your root password can be used to perform any action on your server, so make it long, complex, and unique. Required |
When you’ve provided all required Linode Options, click on the Create button. Your Prometheus app will complete installation anywhere between 2-5 minutes after your Linode has finished provisioning.
Getting Started after Deployment
Access Your Prometheus Instance
Now that your Prometheus One-Click App is deployed, you can log into Prometheus to access its expression browser, alerts, status, and more.
Open a browser and navigate to
http://192.0.2.0:9090/. Replace192.0.2.0with your Linode’s IP address. This will bring you to your Prometheus instance’s expression browser.Verify that Prometheus is serving metrics by navigating to
http://192.0.2.0:9090/metrics. Replace192.0.2.0with your Linode’s IP address. You should see a page of metrics similar to the example below.
Grafana, the open source analytics and metric visualization tool, supports querying Prometheus. Consider deploying a Grafana instance with One-Click Apps to create visualizations for your Prometheus metrics.
Prometheus Default Settings
- Prometheus’ main configuration is located in the
/etc/prometheus/prometheus.ymlfile. - This file includes a scrape configuration for Prometheus itself.
- The scraping interval and evaluation interval are configured globally to be
15s. Thescrape_intervalparameter defines the time between each Prometheus scrape, while theevaluation_intervalparameter is the time between each evaluation of Prometheus’ alerting rules. - The Prometheus Node Exporter is added and enabled. This third-party system exporter is used to collect hardware and OS metrics. Your Node Exporter metrics are sent to port
9100of your Linode.
NoteCurrently, Linode does not manage software and systems updates for One-Click Apps. It is up to the user to perform routine maintenance on software deployed in this fashion.
More Information
You may wish to consult the following resources for additional information on this topic. While these are provided in the hope that they will be useful, please note that we cannot vouch for the accuracy or timeliness of externally hosted materials.
Join our Community
Find answers, ask questions, and help others.
This guide is published under a CC BY-ND 4.0 license.